Repeated Measures Analysis of Variance (Repeated Measures ANOVA) Example:

A repeated measures ANOVA is similar to a paired t-test in that it samples from the same set more than once. This model contains one factor with at least two levels, and the levels are dependent.
Stated Problem:
Researchers want to test the impact of reading existential philosophy on a group of 8 individuals. They measure the happiness of the participants three times, once prior to reading, once after reading the materials for one week, and once after reading the materials for two weeks. We will assume an alpha of .05.
To create the model, first choose “Analyze” from the topmost menu. After this selection has been made, choose “General Linear Model”, and then select “Repeated Measures”.


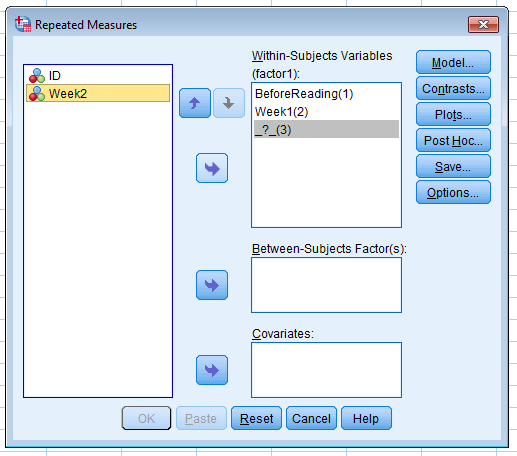
“Within-Subject Variables” will initially be listed as ” _?_(1)" , " _?_(2)", and "_?_(3)". Clicking the topmost arrow pointing right will allow us to modify this list so that instead of the default place holder values, our model is prepared to populate with the necessary level variables. Once the variables have been listed in order, select “OK”.
This populates numerous tables within the output section of SPSS. However, only the table below is worth inspecting.

With this information, we can conclude that the three conditions did not significantly differ pertaining to level of happiness.
No comments:
Post a Comment
Note: Only a member of this blog may post a comment.