Monday, October 16, 2023

The Friendship Paradox

Like many of the critical attributes of life, that which is most evident, lies obscured by monotony. This is especially true as it pertains to mathematical paradoxes, as the most enlightening insights within the field, have the habit of appearing both obvious and universally evident after discovery. Like many mystical traditions, these insights are best discovered through contradiction and reduction.

The Paradox

The Friendship Paradox, in simpler terms, identifies the common phenomenon in which an individual, typically possesses less friends than his friends. Additionally, the sum of friends which his friends possess, will be greater than the sum of his total number of friends.

This paradox possesses wide reaching implications, as it describes events which are self-arising and irrefutable. However, before we can detail applicability, we must demonstrate the paradox as it was initially discerned.

First, let’s get some terminology down.

In graph theory, circular graphics are known as nodes, or vertexes. The lines which illustrate relationships between the nodes are known as edges.


Now, let’s utilize this style of graphical representation to demonstrate the relationships between 5 individuals.


The chart below represents the above relationships, but in a different format.


As each relationship is symmetric, if one friend considers himself to be a friend of another individual, that individual also considers the initial individual to be his friend as well. As shown above, A is friends with B and E. B is friends with both A and E, and also friends with C.

If we derive the mean as it relates to the average number of friends that an individual possesses within our experiment, we come to the value of 2.8.


In this instance, E possesses the most friends, and every individual who is friends with E, possesses less. Therefore, the average number of friends that an individual within a group possesses (2.8), will likely be greater than the actual number of friends that a singular individual possesses. 

The Philosophical Implications   

If a single individual begins to quantify a particular phenomenon as it relates to their person on an individualized basis, or even as it relates to a novel phenomenon, then the natural consequence of this endeavor is that this individual from the onset will find himself at a disadvantage.

For example, a new creation upon its genesis, possessing autonomy, will immediately be concerned with attaining sustenance. This was not a concern which was possessed within the prior state of non-being. In contemplating one’s beauty, a young woman immediately begins to compare herself to those whom she perceives as being more beautiful. We would never anticipate the inverse to occur.

This is the paradox of living, striving to possess more while the value of that which we possess becomes diminished. This is due to the passage of time, but also due to singular possession of a resource also diminishing in value. Something within our possession loses value from the moment of possession, as both the individual and the possession are diminished by the natural passage of time.

Example (2):

Here is another example, if an individual walks into a crowded elevator filled with random strangers, then there is a greater probability that this individual will have the same number, or a greater number of friends, than each stranger within the elevator. However, if the same individual were invited to a party hosted by a friend, then there is a lesser probability of this individual possessing more friends, or a similar number of friends, as compared to each other party attendees. In the elevator scenario, there is no guarantee that any individual within the elevator possesses a single friend. This also includes the individual entering the already crowded elevator. However, in the party scenario, each party goer has at least one friend, that being - the party’s host. In this case, the count begins at the neutral value of 1, except for the case of the party’s host, who is friends with every individual in attendance.

As described above, the friendship paradox also seeks to demonstrate, “the sum of friends which his friends possess, will be greater than the sum of his total number of friends.”

In the case of our first example, this value would be calculated as follows:


To better illustrate this phenomenon, I’ve constructed a new example relationship diagram below:


In this instance, E has more friends than A, B, C, D.

E has 4 friends. While A, B, C, D each have 1 friend (E).

In total: A, B, C, D possess the same number of friends in sum (1+1+1+1).

If A, B, C, or D possessed one additional friend – F, then in total, they would together possess more friends in sum than E (1 + 1 + 1 + 2).

If this were the case, the paradox would hold, as E would have a total of 4 friends, but the total number of his friends of friends would be greater (5).

Conclusion

That's all for today.

I hope that you enjoyed this entry and will visit again soon.

-RD

(R) Utilizing Crowd Prediction Methodologies to Draft the Optimal Fantasy Football Team (II)

What would an application be without proof? A notion?

To prove that the ADP drafting strategy is superior to other ranking methodologies, I performed the following analysis.

#############################################################################

Data Source(s):

#############################################################################


ADP

https://fantasydata.com/nfl/fantasy-football-leaders?position=1&season=2022&seasontype=1&scope=1&subscope=1&scoringsystem=2&startweek=1&endweek=1&aggregatescope=1&range=1

Offense

https://fantasydata.com/nfl/ppr-adp?season=2022&leaguetype=2&type=ppr

Kickers

https://fantasydata.com/nfl/fantasy-football-leaders?position=6&season=2022&seasontype=1&scope=1&subscope=1&scoringsystem=2&startweek=1&endweek=1&aggregatescope=1&range=1

DST

https://fantasydata.com/nfl/fantasy-football-leaders?position=7&season=2022&seasontype=1&scope=1&subscope=1&scoringsystem=2&startweek=1&endweek=1&aggregatescope=1&range=1

#############################################################################

The Analysis (n = 300)

#############################################################################


ADP <- c(1.4, 2.4, 2.7, 4.2, 4.9, 5.8, 7, 7.2, 8.8, 10, 10.6, 12.4, 13.1, 14, 15.3, 16, 16.6, 17.9, 18.5, 19.1, 19.6, 19.8, 21.8, 22.7, 24.7, 25.9, 26.1, 27.3, 27.9, 29.3, 30.5, 31.6, 32.4, 33.2, 33.2, 34.1, 36.1, 38, 39.1, 39.3, 39.4, 39.7, 42.3, 43.2, 43.5, 44.2, 45.1, 46.5, 46.8, 47.3, 48.4, 50.2, 50.9, 51.5, 52.2, 53.9, 54.1, 56, 56.7, 57.9, 59.4, 61.2, 61.5, 62.1, 62.9, 63, 63.8, 63.9, 68, 68.1, 69.2, 69.9, 70.1, 71, 71.4, 71.7, 72, 72.9, 75.3, 75.4, 77.1, 77.9, 82.3, 83.8, 84.4, 84.8, 85, 86.7, 87.9, 89.5, 90.2, 90.2, 90.7, 91.3, 91.7, 91.8, 94.4, 95.9, 96.2, 98.5, 98.7, 99.1, 101.9, 102.6, 102.7, 103.6, 103.7, 105.4, 106.5, 106.7, 107.8, 108.6, 109.7, 109.9, 110.6, 111.6, 113.1, 113.6, 113.9, 114.9, 117.3, 117.7, 118.5, 119, 119.6, 120.5, 121, 121.2, 121.3, 122.7, 124.2, 125, 128.9, 129.8, 130.2, 130.2, 130.3, 130.8, 131.2, 132, 135.1, 135.9, 136.1, 136.3, 137.9, 138.9, 140.1, 140.9, 141.8, 142.7, 143.8, 144.8, 145.3, 145.4, 145.7, 147, 147, 148.1, 148.4, 148.9, 149, 149.4, 151.3, 151.4, 152.1, 152.5, 152.6, 153.8, 154.9, 155.6, 155.7, 156.7, 156.8, 156.8, 158, 158.5, 158.8, 158.9, 159.4, 160.1, 160.5, 160.7, 161, 161.5, 162, 163, 163.5, 164, 164.6, 164.6, 165, 165.2, 165.6, 166, 167, 168, 169, 169.5, 170, 171, 172, 173, 174, 175, 176, 177, 178, 178, 179, 180, 180, 181, 182, 183, 184, 185, 186, 187, 187, 188, 189, 190, 190, 191, 192, 192, 193, 193, 194, 195, 196, 197, 198, 199, 200, 201, 202, 203, 204, 205, 206, 207, 208, 209, 210, 211, 212, 213, 214, 215, 216, 217, 218, 219, 220, 221, 222, 223, 224, 225, 226, 227, 228, 229, 230, 231, 232, 233, 234, 235, 236, 237, 238, 239, 240, 241, 242, 243, 244, 245, 246, 247, 248, 249, 250, 251, 252, 253, 254, 255, 256, 257, 258, 259, 260, 261, 262, 263, 264, 265)


PPR <- c(146.4, 356.36, 372.7, 302.76, 368.66, 201.4, 223.46, 237.8, 242.4, 239.5, 211.7, 335.5, 191.1, 316.6, 248.6, 284, 316.3, 301.6, 281.4, 395.52, 168.4, 42, 226.1, 347.2, 216.5, 190.5, 225.4, 185.8, 200.2, 164, 299.6, 75.6, 220.9, 281.26, 141.3, 205.1, 199.1, 229, 417.4, 177.7, 81.2, 176.5, 43.6, 200.5, 180.7, 115.1, 159.4, 259.2, 350.7, 328.3, 167.6, 84.8, 226.8, 236.08, 51.1, 84.9, 98.3, 378.04, 222.8, 145.6, 90.9, 204.2, 216.7, 200.52, 142.7, 52.2, 171.6, 180, 156, 101.5, 126.8, 248.8, 74.2, 166.4, 79, 177.9, 225.76, 267.6, 141.2, 185.3, 249.1, 239.2, 53.5, 246, 87.1, 198.6, 254.6, 271.66, 88.1, 115.6, 227.8, 151.7, 174.8, 105.7, 108.38, 148.7, 69.4, 202.5, 241.9, 88.6, 148.2, 12.46, 168.3, 219.08, 115.7, 178.6, 147.3, 57.3, 87.9, 159.4, 291.58, 55.8, 198.2, 112.7, 237.3, 126, 98.2, 73.5, 135.7, 165.9, 150, 43.4, 135, 105.4, 215.4, 225.9, 70.4, 230.92, 167.12, 139.1, 166.5, 87.7, 88.4, 102, 122.4, 7, 94.1, 114, 105.04, 155.28, 102.9, 160, 103.9, 101.6, 159, 102, 98, 161, 295.98, 295.62, 115, 87.9, 112, 133, 101, 103, 55.2, 43.92, 116, 97, 131, 180.3, 121, 130.6, 143, 142, 119.8, 215.7, 25.5, 125, 123.6, 99, 39, 110, 97.1, 130, 129, 97, 57, 18, 118, 154, 168, 100, 116.9, 20.1, 104, 98.2, 186, 97, 60.2, 110, 101, 52.2, 155.6, 93.8, 3.2, 110, 169.3, 97.6, 34.4, 161.1, 78.9, 25.8, 51.6, 112.3, 115, 176.3, 198.1, 106, 26.4, 82.7, 149.1, 117.8, 88.3, 81.7, 110.1, 83, 4.5, 50.1, 164.1, 73, 12, 57.68, 139, 61.6, 112, 77.4, 45.4, 46.5, 15.1, 35.5, 72.7, 75.2, 84.5, 110, 0.2, 142.1, 34, 12.2, 83, 82.6, 21.1, 77.2, 196.3, 11.4, 51.7, 8.4, 54.1, 161.24, 46.2, 8.6, 8.4, 13.8, 289, 37.8, 170.08, 128.4, 89.6, 112.8, 104.1, 284.32, 154.16, 59.3, 24.9, 114.5, 121.42, 158.5, 59.8, 98.92, 0, 115.1, 10.2, 181.52, 14.8, 4.2, 12.8, 18.8, 103.9, 196.56, 1.3, 11.8, 16.2, 26, 39.1, 43.1, 53.6, 103.8, 27.3, 303.88, 30.8, 64.5, 3.5, 73.88, 110.2, 64.7, 84.3, 30.5, 10.2, 70.3)

cor.test(ADP, PPR)

Which produces the output:

Pearson's product-moment correlation

data: ADP and PPR

t = -13.394, df = 298, p-value < 2.2e-16

alternative hypothesis: true correlation is not equal to 0

95 percent confidence interval:

-0.6791003 -0.5370390

sample estimates:

cor

-0.6130004


#############################################################################

Creating the Visual Output

#############################################################################


my_data <- data.frame(ADP, PPR)

library("ggpubr")

ggscatter(my_data, x = "ADP", y = "PPR",

add = "reg.line", conf.int = TRUE,

cor.coef = TRUE, cor.method = "pearson",

xlab = "ADP (2022)", ylab = "Player Score (PPR)")

#############################################################################

Conclusion

#############################################################################


There was a negative correlation between the two variables: ADP (n = 300), and Player Score (PPR). ADP (M = 134.81, SD = 73.31), Player Score (PPR) (M = 133.33, SD = 86.66), Conditions; t(298) = -13.394 , p < .01. Pearson Product-Moment Correlation Coefficient: r = -0.61.

#############################################################################

As the findings indicate, there is a significant negative correlation as it pertains to ADP and player performance (PPR - 2022 Season). In plain terms, this means that we should typically expect to see better fantasy performance from players with lower ADP rankings. I hope that everyone enjoyed this article and my adherence to APA reporting standards. <3

Until next time. 

Stay cool, Data Heads.

-RD

Monday, October 9, 2023

Utilizing Crowd Prediction Methodologies to Draft the Optimal Fantasy Football Team

To win your league in Fantasy Football, or at least qualify for the playoffs, you don’t need to buy magazines, study tape, or watch ESPN. All that is required, is a general understanding of crowd psychology.

What is ADP?

ADP represents the average draft position for players in fantasy drafts. Each league, for each fantasy sport, typically displays this player value during the drafting process. This value, as the name suggests, is derived from where a particular player was selected by other “fantasy team owners”, during prior drafts.

As was discussed within a previous article demonstrating draft order and its impact on a fantasy team’s final placement, if each fantasy team owner drafted optimally within their respective position, we would expect the final standings to directly reflect the initial draft order.

However, how can an individual be sure that he is drafting optimally? The answer is simpler than one might assume. To achieve optimal drafting potential, one must adhere to drafting players with the best available ADP value throughout the drafting process.

Why does it Work?

Following the crowd consensus, should provide a fantasy participant with their best opportunity for victory. The strictest adherent to this methodology, will benefit most from the number non-adherents within their league. Let’s consider why this is the case.

While pundit, or site rankings of players are often determined by a single individual, or a group of informed individuals, ADP rankings are determined by draft consensus. Meaning, that there are more minds at work as it pertains to determining a player’s draft value. These ranks are also assigned through the drafting process. This differs from other ranking processes, in that, the act of drafting establishes the value. This is similar as to how market participants set prices through buying and selling assets. Whereas, the ranking process is more akin to the way in which planned economies function.   

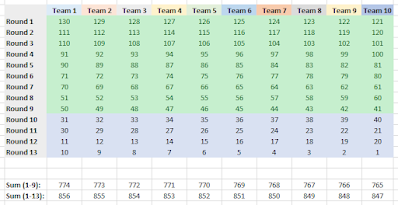
We’ll assume that ADP perfectly correlates with the eventual points scored by each player within the league. Therefore, with this assumption in place, and also assuming that each league participant drafts optimally, we should expect to see point distributions resemble something like the graphic below. 


(In our example scenario, each subsequent player is valued at one point less than the previous player.)

Therefore, all things being equal, we would expect the final point totals for each league participant to be:


Gaining the Edge

In every instance, the largest advantage belongs to the team which drafts first, with diminishing advantage being assessed sequentially throughout the remaining draft order. To attempt to compensate for this diminishment, or to expand one’s edge regardless of draft position, a league participant should strongly adhere to the ADP value ranking system while drafting. By not attempting to gain an edge through self perceived insight, opportunities will arise as a result of opponents who attempt otherwise.

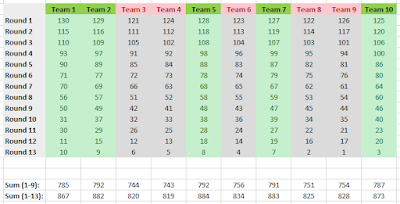
Every draft misstep is the micro-process of reallocating points from your team to another team within your league. In the example below, the teams highlighted in green are adhering to a strict ADP drafting strategy. The teams highlighted in red, instead are going for a less strict approach.


As is shown in the graphic, the ADP adhering teams were able to benefit from the mistakes made by their opponents. In each instance, the green teams were able to draft the players which were passed upon by their red counterparts. Thus, the ADP adhering teams increased their edge at the expense of the non-adhering teams.


I Know that I Know Nothing


The above strategy, functions on the foundation of two re-enforcing cognitive biases. One being the overestimation of one’s own abilities and talents, and the other being the discounting of the abilities and talents of others.

As far as football is concerned, I have personally witnessed friends who watch far more football than I do, who know far more about the players than I do, blow out their drafts, and fail to make their league’s playoffs in complex and interesting ways. In almost every case, the culprit tends to be impatience and exotic maneuvering. What’s also strange about this cohort of individuals, is that they tend to quickly abandon the strange individualized strategies which initially required a high level of conviction to attempt. This phenomenon itself might warrant an article in the future. 

Be sure to watch the waiver wire, as further edge can be gained from managers who prematurely release underperforming players. Also, it should be noted, that ADP rankings as a drafting criteria, are only applicable in leagues which do not utilize custom rule sets.