Today, through the magic of R software, I will demonstrate how to utilize code to optimize your daily fantasy sports line-up. This particular example will be specific to the Yahoo daily fantasy sports platform, and to the sport of basketball.
I also want to give credit, where credit is due.
The code presented below is a heavily modified variation of code initially created by: Patrick Clark.
The original code source case be found here: http://patrickclark.info/Lineup_Optimizer.html
Example:
First, you’ll need to access Yahoo’s Daily Fantasy page. I’ve created an NBA Free QuickMatch, which is a 1 vs. 1 contest against an opponent where no money changes hands.
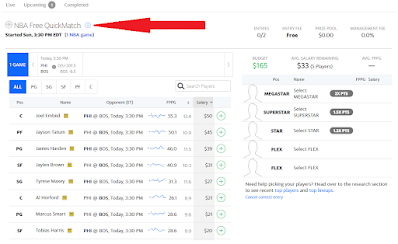
This page will look a bit different during the regular season, as the NBA playoffs are currently underway. That aside, our next step is to download all of the current player data. This can be achieved by clicking on the “i” bubble icon.
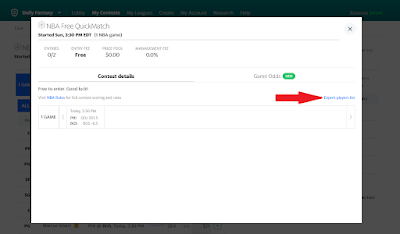
Next, click on the “Export players list” link. This will download the previously mentioned player data.
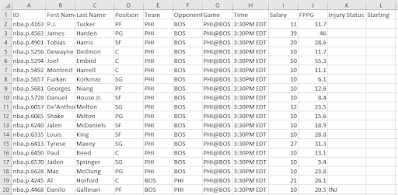
The player data should resemble the (.csv) image below:
Prior to proceeding to the subsequent step, we need to do a bit of manual data clean up.
Any player who is injured or not starting, I removed from the data set. I also concatenated the First Name and Last Name fields, and placed that concatenation within the ID variable. Next, I removed all variables except for the following: ID (newly modified), Position, Salary, and FPPG (Fantasy Points Per Game).
The results should resemble the following image:
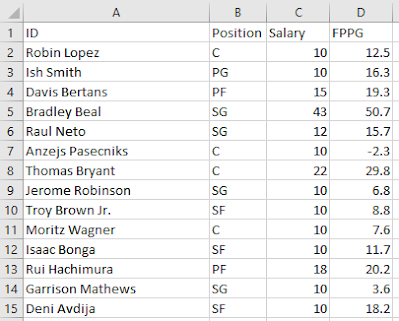
(Specific player data and all associated variables will differ depending on the date of download)
Now that the data has been formatted, we’re ready to code!
###################################################################
library(lpSolveAPI)
library(tidyverse)
# It is easier to input the data as an Excel file if possible #
# Player names (ID) have the potential to upset the .CSV format #
library(readxl)
# Be sure to set the played data file path to match your directory / file name #
PlayerPool <- read_excel("C:/Users/Your_Modified_Players_List.xlsx")
# Create some positional identifiers in the pool of players to simplify linear constraints #
# This code creates new position column variables, and places a 1 if a player qualifies for a position #
PlayerPool$PG_Check <- ifelse(PlayerPool$Position == "PG",1,0)
PlayerPool$SG_Check <- ifelse(PlayerPool$Position == "SG",1,0)
PlayerPool$SF_Check <- ifelse(PlayerPool$Position == "SF",1,0)
PlayerPool$PF_Check <- ifelse(PlayerPool$Position == "PF",1,0)
PlayerPool$C_Check <- ifelse(PlayerPool$Position == "C",1,0)
PlayerPool$One <- 1
# This code modifies the position columns so that each variable is a vector type #
PlayerPool$PG_Check <- as.vector(PlayerPool$PG_Check)
PlayerPool$SG_Check <- as.vector(PlayerPool$SG_Check)
PlayerPool$SF_Check <- as.vector(PlayerPool$SF_Check)
PlayerPool$PF_Check <- as.vector(PlayerPool$PF_Check)
PlayerPool$C_Check <- as.vector(PlayerPool$C_Check)
# This code orders each player ID by position #
PlayerPool <- PlayerPool[order(PlayerPool$PG_Check),]
PlayerPool <- PlayerPool[order(PlayerPool$SG_Check),]
PlayerPool <- PlayerPool[order(PlayerPool$SF_Check),]
PlayerPool <- PlayerPool[order(PlayerPool$PF_Check),]
PlayerPool <- PlayerPool[order(PlayerPool$C_Check),]
# Appropriately establish variables in order to perform the "solver" function #
Num_Players <- length(PlayerPool$One)
lp_model = make.lp(0, Num_Players)
set.objfn(lp_model, PlayerPool$FPPG)
lp.control(lp_model, sense= "max")
set.type(lp_model, 1:Num_Players, "binary")
# Total salary points avalible to the player #
# In the case of Yahoo, the salary points are set to ($)200 #
add.constraint(lp_model, PlayerPool$Salary, "<=",200)
# Maximum / Minimum Number of Players necessary for each position type #
add.constraint(lp_model, PlayerPool$PG_Check, "<=",3)
add.constraint(lp_model, PlayerPool$PG_Check, ">=",1)
# Maximum / Minimum Number of Players necessary for each position type #
add.constraint(lp_model, PlayerPool$SG_Check, "<=",3)
add.constraint(lp_model, PlayerPool$SG_Check, ">=",1)
# Maximum / Minimum Number of Players necessary for each position type #
add.constraint(lp_model, PlayerPool$SF_Check, "<=",3)
add.constraint(lp_model, PlayerPool$SF_Check, ">=",1)
# Maximum / Minimum Number of Players necessary for each position type #
add.constraint(lp_model, PlayerPool$PF_Check, "<=",3)
add.constraint(lp_model, PlayerPool$PF_Check, ">=",1)
# Maximum / Minimum Number of Players necessary for each position type (only require one (C)enter) #
add.constraint(lp_model, PlayerPool$C_Check, "=",1)
# Total Numner of Players Needed for the entire Fantasy Line-up #
add.constraint(lp_model, PlayerPool$One, "=",8)
# Perform the Solver function #
solve(lp_model)
# Projected_Score provides the projected score summed from the optimized projected line-up (FPPG) #
Projected_Score <- crossprod(PlayerPool$FPPG,get.variables(lp_model))
get.variables(lp_model)
# The optimal_lineup data frame provides the optimized line-up selection #
optimal_lineup <- subset(data.frame(PlayerPool$ID, PlayerPool$Position, PlayerPool$Salary), get.variables(lp_model) == 1)
If we take a look at our:
Projected_Score
We should receive an output which resembles the following:
> Projected_Score
[,1]
[1,] 279.5
Now, let’s take a look at our:
optimal_lineup
Our output should resemble something like:
PlayerPool.ID PlayerPool.Position PlayerPool.Salary
3 Marcus Smart PG 20
51 Bradley Beal SG 43
108 Tyrese Haliburton SG 16
120 Jerami Grant SF 27
130 Eric Gordon SF 19
148 Brandon Ingram SF 36
200 Darius Bazley PF 19
248 Steven Adams C 20
With the above information, we are prepared to set our line up.
You could also run this line of code:
optimal_lineup <- subset(data.frame(PlayerPool$ID, PlayerPool$Position, PlayerPool$Salary, PlayerPool$FPPG), get.variables(lp_model) == 1)
optimal_lineup
Which provides a similar output that also includes point projections:
PlayerPool.ID PlayerPool.Position PlayerPool.Salary PlayerPool.FPPG
3 Marcus Smart PG 20 29.8
51 Bradley Beal SG 43 50.7
108 Tyrese Haliburton SG 16 26.9
120 Jerami Grant SF 27 38.4
130 Eric Gordon SF 19 30.7
148 Brandon Ingram SF 36 43.2
200 Darius Bazley PF 19 29.7
248 Steven Adams C 20 30.1
Summing up PlayerPool.FPPG, we reach the value: 279.5. This was the same value which we observed within the Projected_Score matrix.
Conclusion:
While this article demonstrates a very interesting concept, I would be remiss if I did not advise you to NOT gamble on daily fantasy. This post was all in good fun, and for educational purposes only. By all means, defeat your friends and colleagues in free leagues, but do not turn your hard-earned money over to gambling websites.
The code presented within this entry may provide you with a minimal edge, but shark players are able to make projections based on far more robust data sets as compared to league FPPG.
In any case, the code above can be repurposed for any other daily fantasy sport (football, soccer, hockey, etc.). Remember, only to play for fun and for free.
I also want to give credit, where credit is due.
The code presented below is a heavily modified variation of code initially created by: Patrick Clark.
The original code source case be found here: http://patrickclark.info/Lineup_Optimizer.html
Example:
First, you’ll need to access Yahoo’s Daily Fantasy page. I’ve created an NBA Free QuickMatch, which is a 1 vs. 1 contest against an opponent where no money changes hands.

This page will look a bit different during the regular season, as the NBA playoffs are currently underway. That aside, our next step is to download all of the current player data. This can be achieved by clicking on the “i” bubble icon.

Next, click on the “Export players list” link. This will download the previously mentioned player data.
The player data should resemble the (.csv) image below:

Prior to proceeding to the subsequent step, we need to do a bit of manual data clean up.
Any player who is injured or not starting, I removed from the data set. I also concatenated the First Name and Last Name fields, and placed that concatenation within the ID variable. Next, I removed all variables except for the following: ID (newly modified), Position, Salary, and FPPG (Fantasy Points Per Game).
The results should resemble the following image:

(Specific player data and all associated variables will differ depending on the date of download)
Now that the data has been formatted, we’re ready to code!
###################################################################
library(lpSolveAPI)
library(tidyverse)
# It is easier to input the data as an Excel file if possible #
# Player names (ID) have the potential to upset the .CSV format #
library(readxl)
# Be sure to set the played data file path to match your directory / file name #
PlayerPool <- read_excel("C:/Users/Your_Modified_Players_List.xlsx")
# Create some positional identifiers in the pool of players to simplify linear constraints #
# This code creates new position column variables, and places a 1 if a player qualifies for a position #
PlayerPool$PG_Check <- ifelse(PlayerPool$Position == "PG",1,0)
PlayerPool$SG_Check <- ifelse(PlayerPool$Position == "SG",1,0)
PlayerPool$SF_Check <- ifelse(PlayerPool$Position == "SF",1,0)
PlayerPool$PF_Check <- ifelse(PlayerPool$Position == "PF",1,0)
PlayerPool$C_Check <- ifelse(PlayerPool$Position == "C",1,0)
PlayerPool$One <- 1
# This code modifies the position columns so that each variable is a vector type #
PlayerPool$PG_Check <- as.vector(PlayerPool$PG_Check)
PlayerPool$SG_Check <- as.vector(PlayerPool$SG_Check)
PlayerPool$SF_Check <- as.vector(PlayerPool$SF_Check)
PlayerPool$PF_Check <- as.vector(PlayerPool$PF_Check)
PlayerPool$C_Check <- as.vector(PlayerPool$C_Check)
# This code orders each player ID by position #
PlayerPool <- PlayerPool[order(PlayerPool$PG_Check),]
PlayerPool <- PlayerPool[order(PlayerPool$SG_Check),]
PlayerPool <- PlayerPool[order(PlayerPool$SF_Check),]
PlayerPool <- PlayerPool[order(PlayerPool$PF_Check),]
PlayerPool <- PlayerPool[order(PlayerPool$C_Check),]
# Appropriately establish variables in order to perform the "solver" function #
Num_Players <- length(PlayerPool$One)
lp_model = make.lp(0, Num_Players)
set.objfn(lp_model, PlayerPool$FPPG)
lp.control(lp_model, sense= "max")
set.type(lp_model, 1:Num_Players, "binary")
# Total salary points avalible to the player #
# In the case of Yahoo, the salary points are set to ($)200 #
add.constraint(lp_model, PlayerPool$Salary, "<=",200)
# Maximum / Minimum Number of Players necessary for each position type #
add.constraint(lp_model, PlayerPool$PG_Check, "<=",3)
add.constraint(lp_model, PlayerPool$PG_Check, ">=",1)
# Maximum / Minimum Number of Players necessary for each position type #
add.constraint(lp_model, PlayerPool$SG_Check, "<=",3)
add.constraint(lp_model, PlayerPool$SG_Check, ">=",1)
# Maximum / Minimum Number of Players necessary for each position type #
add.constraint(lp_model, PlayerPool$SF_Check, "<=",3)
add.constraint(lp_model, PlayerPool$SF_Check, ">=",1)
# Maximum / Minimum Number of Players necessary for each position type #
add.constraint(lp_model, PlayerPool$PF_Check, "<=",3)
add.constraint(lp_model, PlayerPool$PF_Check, ">=",1)
# Maximum / Minimum Number of Players necessary for each position type (only require one (C)enter) #
add.constraint(lp_model, PlayerPool$C_Check, "=",1)
# Total Numner of Players Needed for the entire Fantasy Line-up #
add.constraint(lp_model, PlayerPool$One, "=",8)
# Perform the Solver function #
solve(lp_model)
# Projected_Score provides the projected score summed from the optimized projected line-up (FPPG) #
Projected_Score <- crossprod(PlayerPool$FPPG,get.variables(lp_model))
get.variables(lp_model)
# The optimal_lineup data frame provides the optimized line-up selection #
optimal_lineup <- subset(data.frame(PlayerPool$ID, PlayerPool$Position, PlayerPool$Salary), get.variables(lp_model) == 1)
If we take a look at our:
Projected_Score
We should receive an output which resembles the following:
> Projected_Score
[,1]
[1,] 279.5
Now, let’s take a look at our:
optimal_lineup
Our output should resemble something like:
PlayerPool.ID PlayerPool.Position PlayerPool.Salary
3 Marcus Smart PG 20
51 Bradley Beal SG 43
108 Tyrese Haliburton SG 16
120 Jerami Grant SF 27
130 Eric Gordon SF 19
148 Brandon Ingram SF 36
200 Darius Bazley PF 19
248 Steven Adams C 20
With the above information, we are prepared to set our line up.
You could also run this line of code:
optimal_lineup <- subset(data.frame(PlayerPool$ID, PlayerPool$Position, PlayerPool$Salary, PlayerPool$FPPG), get.variables(lp_model) == 1)
optimal_lineup
Which provides a similar output that also includes point projections:
PlayerPool.ID PlayerPool.Position PlayerPool.Salary PlayerPool.FPPG
3 Marcus Smart PG 20 29.8
51 Bradley Beal SG 43 50.7
108 Tyrese Haliburton SG 16 26.9
120 Jerami Grant SF 27 38.4
130 Eric Gordon SF 19 30.7
148 Brandon Ingram SF 36 43.2
200 Darius Bazley PF 19 29.7
248 Steven Adams C 20 30.1
Summing up PlayerPool.FPPG, we reach the value: 279.5. This was the same value which we observed within the Projected_Score matrix.
Conclusion:
While this article demonstrates a very interesting concept, I would be remiss if I did not advise you to NOT gamble on daily fantasy. This post was all in good fun, and for educational purposes only. By all means, defeat your friends and colleagues in free leagues, but do not turn your hard-earned money over to gambling websites.
The code presented within this entry may provide you with a minimal edge, but shark players are able to make projections based on far more robust data sets as compared to league FPPG.
In any case, the code above can be repurposed for any other daily fantasy sport (football, soccer, hockey, etc.). Remember, only to play for fun and for free.
-RD