There are not many articles or videos online which specifically address the topic of “syntax”. Syntax, in this particular instance, refers to the coding language of IBM SPSS. In this article, I will briefly discuss a few useful elements which should lead to an increase in coding efficiency and a greater understanding of IBM SPSS coding syntax. Examples will primarily focus on situations which require the utilization of frequency analysis.
Creating New Syntax
To create new syntax, you must first select “File” from the upper left drop down menu, then select “New”, followed by “Syntax”.

Thus should present the following interface:

I typically begin my code files with the following lines:
* Encoding: UTF-8.
* Establish working directory
cd 'C:\DirectoryPathWay\User\etc\'.
* Specify file path (make sure extension is included)
GET FILE='ExampleFile.sav'.
The first line:
cd 'C:\DirectoryPathWay\User\etc\'.
Establishes the directory from which you will be accessing your files.
The next line:
GET FILE='ExampleFile.sav'.
Is specifying the file in which the code will be referring to when performing specific functions.
You will, of course, have to modify both of the lines above so that they refer to non-fictitious items.
To run syntax from the console, you must first highlight the portions in which you wish to run, then click on the green arrow above.

The best way to generate examples of code to provide functions which you wish to utilize, is to first initiate a function from the graphical user interface. Doing such, provides the product of the function to be displayed within the output window. Along with such, is the code, which if ran as syntax, would also perform the same function.
Example (SPSS):
Let us consider the following data set:


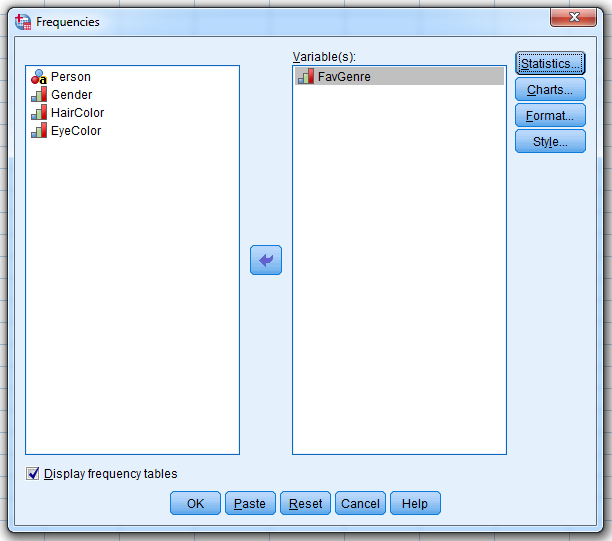
Once this step has been completed, click “OK”.
The following output will be produced:


This code can be copied and re-utilized from the console window to re-create the output. This can be helpful when multiple queries are required, as it eliminates the tedious process of utilizing the user interface for each independent request.
For example, if you wanted to run the frequency function for multiple variables independently, you could utilize the following code:

The inclusion of such would resemble:


To perform a descriptive frequency output, we must make the following selections. From the topmost menu bar, select “Analyze”, then select “Descriptive Statistics”, finally, select “Descriptive”.

From the menu that is generated from this series of actions, utilize the middle arrow to designate the column “FavGenre” as a “Variable(s)”.


This will produce the following output:

Though it is inapplicable as it pertains to our current example, if there is a situation in which you wish to generate descriptive summary output, the following syntax can be utilized:
DESCRIPTIVES VARIABLES=Height
/STATISTICS=MEAN STDDEV MIN MAX.
If you would like to perform this function from the graphical interface, please follow the proceeding steps. From the topmost menu bar, select “Analyze”, then select “Descriptive Statistics”, finally, select “Descriptives”.

After designating the appropriate variable for analysis. A table similar to the output below should be produced.

Generating these sorts of summaries is rather simple and straightforward. However, what if we wanted to analyze data based on specific criteria?
For our example, we will assume that we only want to generate a frequency table which lists the preferred music genre for females.
The code to achieve such is as follows:

The filter temporarily disables data observations which contain a variable which matches the specified value.
If you were to run this code block independently, you would notice the following impact which it has on the data frame.

The initial lines of code perform the query itself, with the final line disabling the filter. It is important that the filter be disabled (FILTER OFF.), if additional queries are to be performed which do not specifically pertain to the parameters of the current analysis.
WARNING!!!
If you are presented with errors when applying filters, these prompts will typically stem from one of the following:
For our example, we will assume that we only want to generate a frequency table which lists the preferred music genre for females.
The code to achieve such is as follows:

If you were to run this code block independently, you would notice the following impact which it has on the data frame.

The initial lines of code perform the query itself, with the final line disabling the filter. It is important that the filter be disabled (FILTER OFF.), if additional queries are to be performed which do not specifically pertain to the parameters of the current analysis.
WARNING!!!
If you are presented with errors when applying filters, these prompts will typically stem from one of the following:
1. You are applying a filter to a data label. Remember in cases which require such filtering, to always apply the filter to the underlying numerical variable.
2. If you are applying a filter to a string variable, do not forget to include the variable within quotes (‘ ‘) .
If there is a situation in which you must apply multiple filters prior to performing analysis, the following code blocks should provide useful:
Applying multiple filters:
USE ALL.
COMPUTE filter_$=(Gender=0 AND Gender=1).
FILTER BY filter_$.
EXECUTE.
Setting a query variable to NOT EQUAL a value:
USE ALL.
COMPUTE filter_$=(Gender NE 0).
FILTER BY filter_$.
EXECUTE.
Generating query data where a variable equals one value OR another value:
USE ALL.
COMPUTE filter_$=(FavGenre = 1 OR FavGenre = 2).
FILTER BY filter_$.
EXECUTE.
That’s all for now, Data Heads! Stay subscribed for more informative content!
No comments:
Post a Comment
Note: Only a member of this blog may post a comment.